Contour Lines or Shaded Relief: Two Ways to Read a Landscape
Contour lines or shaded relief can reveal different parts of a landscape. Learn what each map shows, what it hides, and how to read them together.
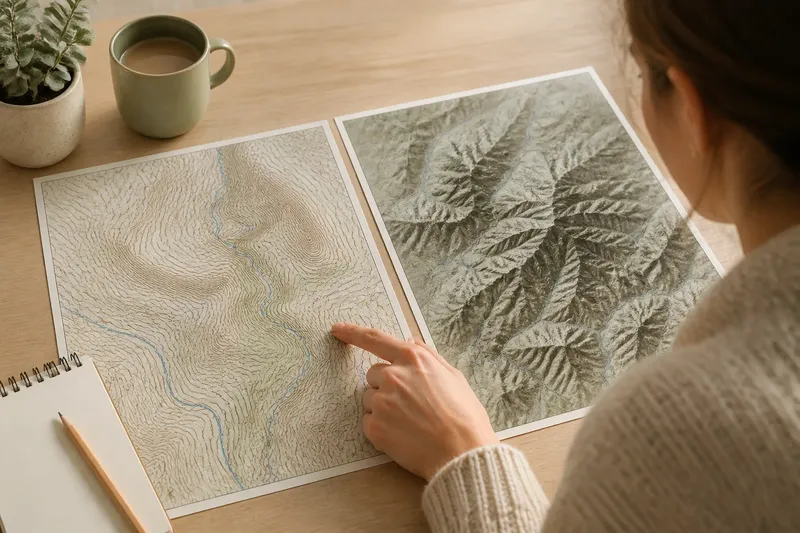
Contour lines show elevation through measured intervals, while shaded relief makes slopes appear light or dark; each gives a different view of the same ground. If you are choosing between contour lines or shaded relief, the useful question is not which map is better, but which feature you need to notice. One helps you read elevation and compare heights; the other makes the shape of ridges, valleys, and slopes easier to see at a glance.
What do contour lines show?
A contour line connects points at the same elevation. The interval—the vertical difference between neighboring contour lines—is usually stated in the map legend. Once you know it, the pattern becomes a compact record of how the land rises and falls.
Lines close together indicate a steep slope because elevation changes over a short horizontal distance. Lines farther apart suggest gentler ground. Closed loops often mark a summit or a depression, but the surrounding lines and map symbols help distinguish one from the other. A marked spot elevation can clarify a peak, while hachures, small inward strokes, may indicate a hollow on some maps.
Contour lines are particularly useful when you need to compare elevation or follow a feature across the map. They can show how a ridge bends, where a valley narrows, or how a slope changes. Their precision is also a limit: a dense set of lines can look busy, and a reader who has not learned the interval may mistake the pattern for decoration.
What does shaded relief show?
Shaded relief uses tones to suggest how light would fall across the land. A simulated light source brightens some slopes and darkens others, giving a flat map the appearance of raised terrain. Ridges and gullies can stand out as forms rather than as collections of elevation marks.
Its strength is visual recognition. A broad valley may read as a continuous trough, and a branching drainage pattern may become easier to follow. This makes shaded relief helpful when you want an immediate impression of the land’s overall shape, especially where contour lines are crowded.
But the shading is an interpretation, not a photograph of actual light or a direct record of elevation. The apparent direction of a slope depends on the chosen light direction. A spur or hollow can seem to reverse if the viewer mentally assigns the wrong side as illuminated. Shading can also make a gentle slope look dramatic, or obscure smaller features beneath dark tones.
Which map makes slopes clearer?
Shaded relief often makes a slope easier to recognize quickly; contour lines make its steepness easier to assess. Relief shading shows the surface as a coherent form, while contour spacing provides a consistent visual clue about how rapidly elevation changes.
Think of contour lines as the marks on a measuring cup and shaded relief as the shadow cast by the cup. The shadow makes the shape easy to grasp, but it does not tell you the exact fill level. Likewise, relief shading gives useful form, while contours carry elevation relationships that shading alone cannot supply.
Neither view settles every question. A dark band in shaded relief may indicate a steep face, but the map’s color scheme and lighting affect its appearance. Closely spaced contours support the interpretation of a steep slope, yet they do not by themselves tell you whether the ground is rocky, wooded, or crossed by a stream.
Can shaded relief show elevation?
Shaded relief suggests relative form, but it does not usually provide a reliable elevation reading on its own. A bright area may be high ground or simply a surface facing the simulated light. Check contour labels, spot elevations, or the map’s elevation legend to establish actual heights.
This distinction matters when comparing places on opposite sides of a ridge. Shading may make one side look higher because it is brighter, even when the two areas are at similar elevations. Contours or labeled elevations provide a more dependable basis for that comparison.
Why do contours form V shapes?
Where contour lines cross a stream valley, they commonly bend into V shapes that point uphill, toward the source of the valley. This pattern reflects the way the ground rises from the channel toward higher land on either side. A stream symbol or other drainage information helps confirm the interpretation.
V shapes can also appear along ridges, with the bend pointing downhill. The surrounding contour pattern is what distinguishes a ridge from a valley; a single V is not enough. Shaded relief can make the broader form easier to recognize, while contour lines show how elevation changes across it.
Which map should you use?
Choose contour lines when the question depends on elevation intervals, relative height, or the shape of a route across rising and falling ground. Choose shaded relief when you need to recognize the overall arrangement of landforms. If a map offers both, use them as complementary layers rather than competing pictures.
For example, say you are examining an invented county map and want to understand why a road bends around a long ridge. First, use shaded relief to see the ridge’s broad direction and its relationship to the neighboring valley. Then follow the contour lines to check whether the road crosses a saddle—a lower point along the ridge—or skirts a steep flank. The two views answer related but different parts of the question.
For a county landscape, this pairing can make a useful difference in how boundaries and settlements appear. A boundary may cross a ridge, follow a valley, or run over gentler ground, but the map’s visual style cannot establish why the line was drawn there. It can show the terrain the line crosses; the boundary itself needs its own evidence.
What can each map miss?
Contour lines can make a landscape feel abstract. They describe elevation, not surface cover, and may hide the visual continuity of a broad landform when the map is crowded. Their spacing also depends on contour interval and map scale, so a pattern that looks sparse on one map may be dense on another.
Shaded relief can conceal small landforms when contrast is strong or the image is reduced. It may also confuse readers who treat illumination as a direct signal of height. Neither style tells you by itself how a place is used, where a local boundary lies, or what a feature is called.
Map legends, scale, and source notes matter. A contour interval tells you the vertical gap represented by adjacent lines; a relief legend explains how tones are assigned, if one is provided. For questions that depend on a label, mapmaker’s instructions, or local rules, consult the relevant source rather than inferring an answer from terrain alone.
How should you read both together?
Start by identifying the map’s scale and contour interval, then look at the shaded relief for broad ridges, valleys, and basins. Use the contour pattern to check changes in elevation and to trace how those landforms connect. Return to the relief view when the lines become hard to interpret as a continuous shape.
Keep the map’s purpose in view. A topographic map is a model of selected features, not the landscape in full. Contours may be generalized, and relief shading is designed to clarify form rather than reproduce every surface detail. For a particular place, compare the map with other relevant layers, such as streams, roads, or named features, without assuming that any one layer tells the whole story.
Contour lines or shaded relief are most useful when you treat each as a different kind of evidence: one encodes elevation through intervals, the other emphasizes visible form. Read them together, and you can distinguish what the terrain seems to look like from what the map actually records—an especially useful habit when tracing the shape of a county landscape.